


About This Lesson
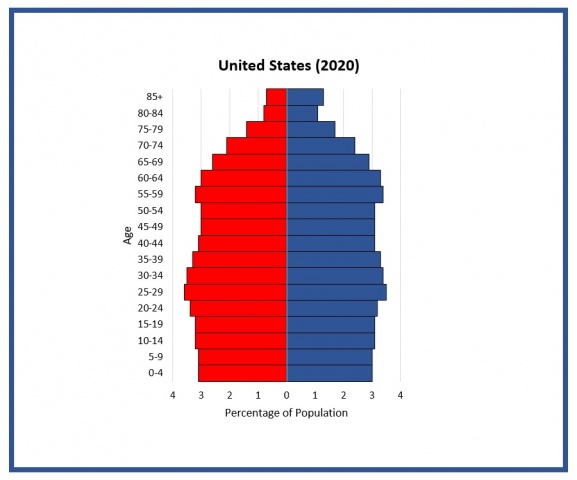
Students construct and interpret population pyramids (age-sex distribution charts) and discuss differences in population characteristics at different points in U.S. history and make projections for the future.
Students will be able to:
- Calculate percentages using raw numbers for each age/sex group in a given population.
- Construct a population age/sex distribution graph for one point in U.S. history.
- Make connections between the shape of a population pyramid graph and factors that may have affected U.S. population patterns at different time periods.
This lesson is 1 of 14 in a resources packet focusing on U.S. demographics, society and environment. Download free here: https://populationeducation.org/resource/330-million-in-the-usa/


