


About This Lesson
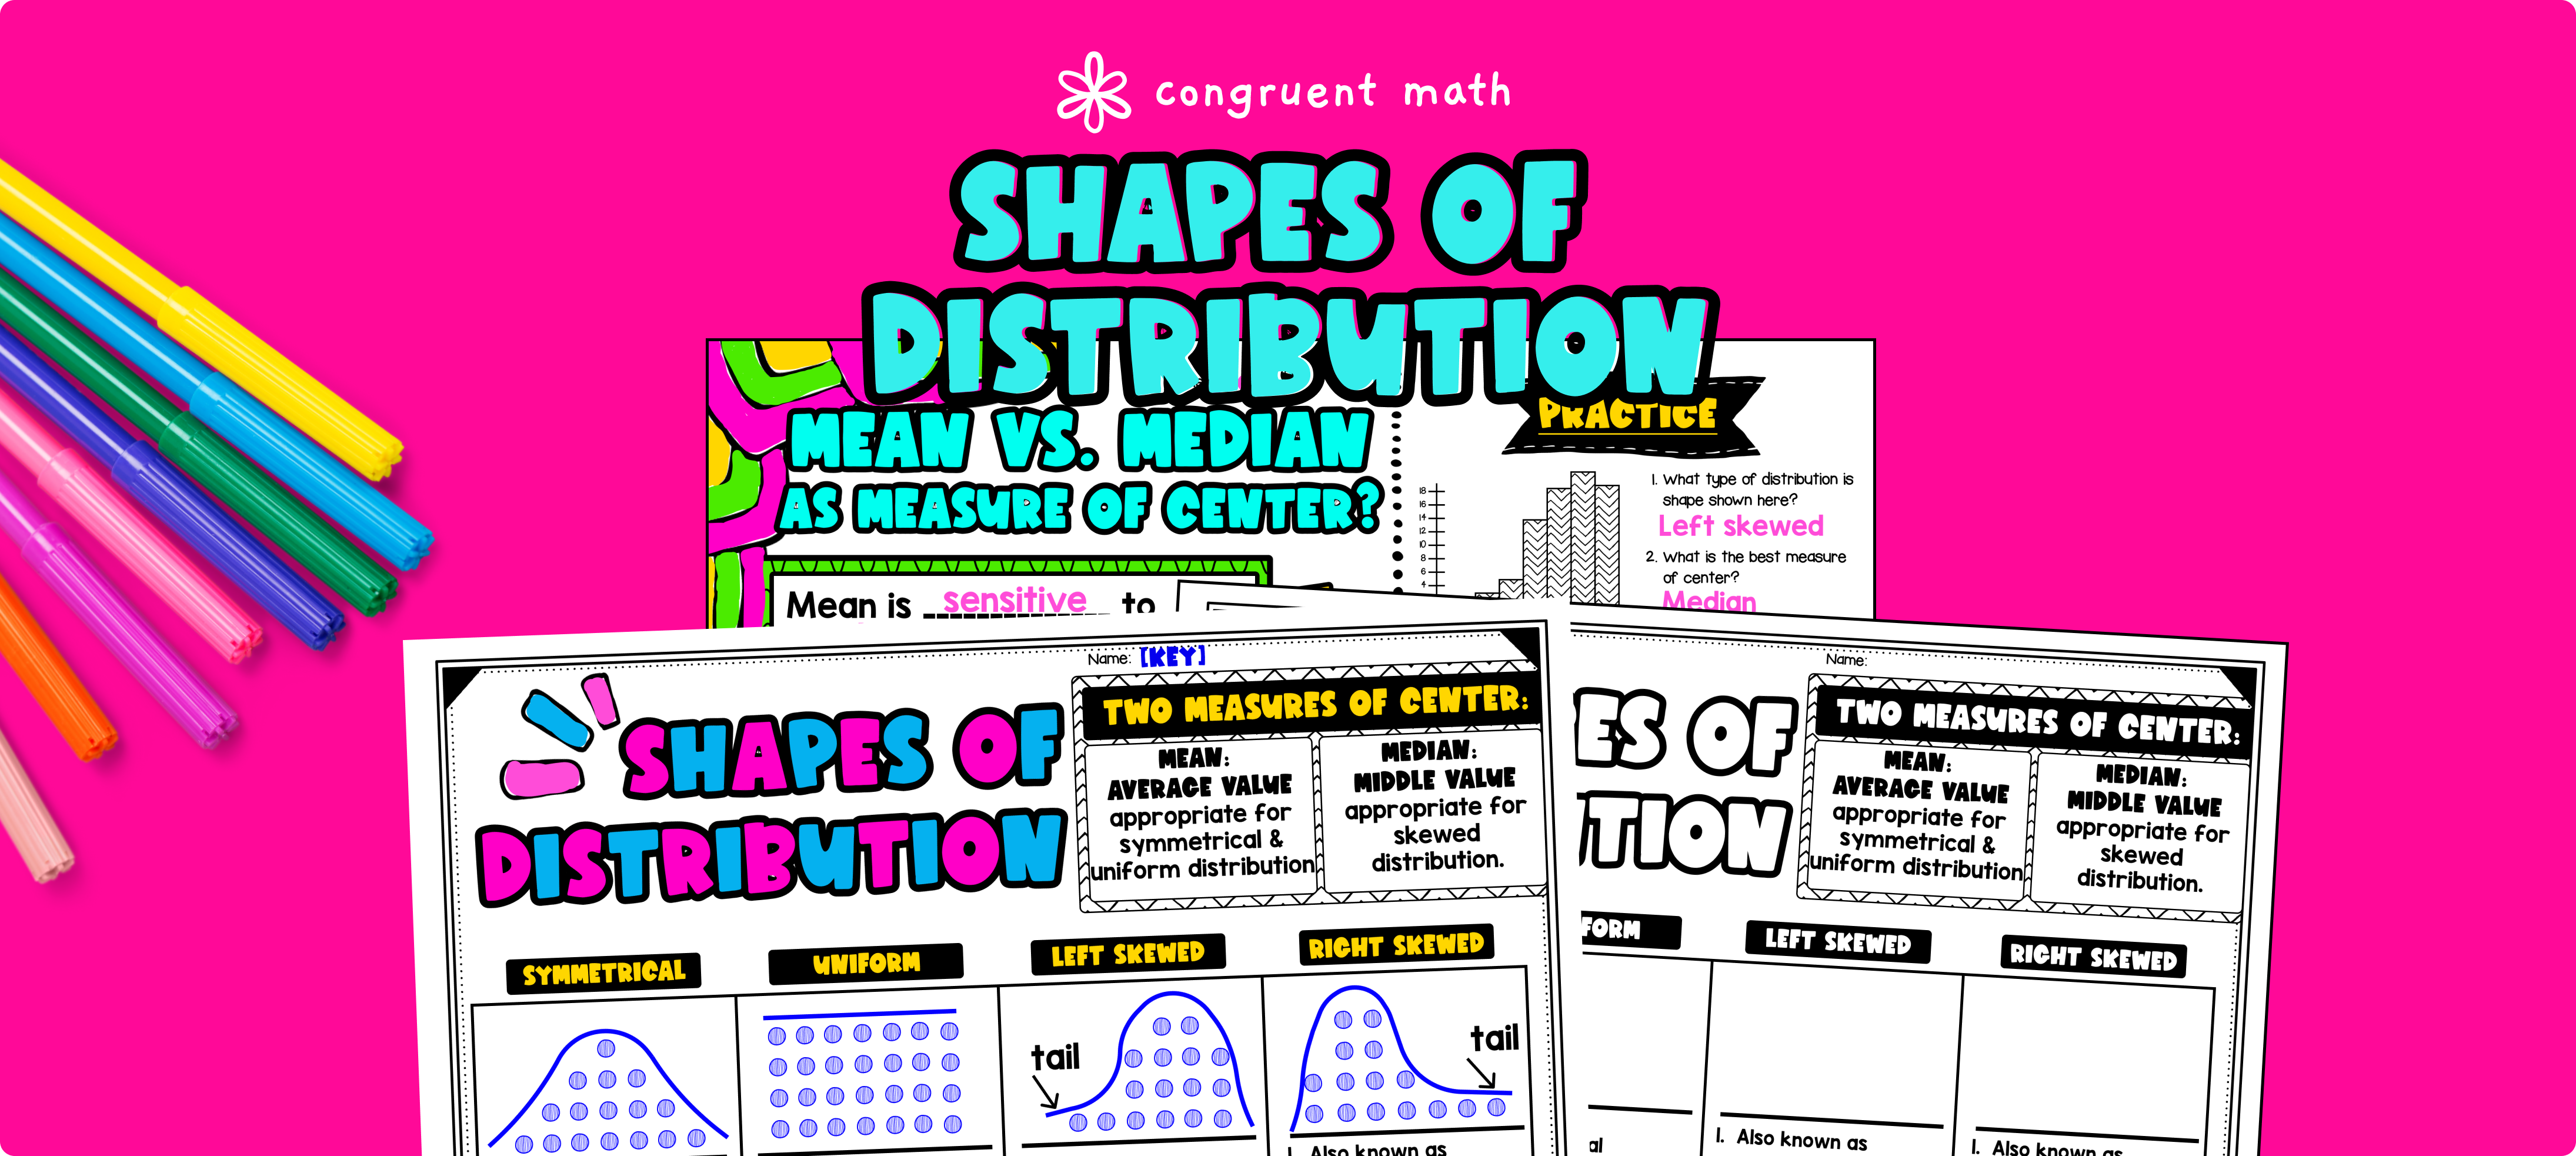
Ever wondered how to teach shapes of distribution and appropriate measure of center in an engaging way to your 6th grade students? In this lesson plan, students will learn about symmetrical, uniform, and skewed shapes of distribution and their real-life applications. They will also learn how to determine whether mean or median is the more appropriate measure of center, based on whether or not there are outliers in the data set.
Through artistic, interactive guided notes, a check for understanding, a maze worksheet, and a doodle & color by number activity, students will gain a comprehensive understanding of shapes of distributions and measure of center.
The lesson culminates with a real-life example that explores how analyzing consumer data like age, income, and spending habits can help businesses target their advertising and products more effectively.


