Graphing Unit
lesson
2376 Downloads
Write a review
beta
EdBrAIn It
EdBrAIn uses AI to customize lesson resources for your students’ needs.

Graphing Unit

Share

Share On Facebook
Share On Twitter
Share On Pinterest
Share On LinkedIn
Email
Grade Level Grades K-2
Resource Type Lesson Plan
Standards Alignment
State-specific

About This Lesson

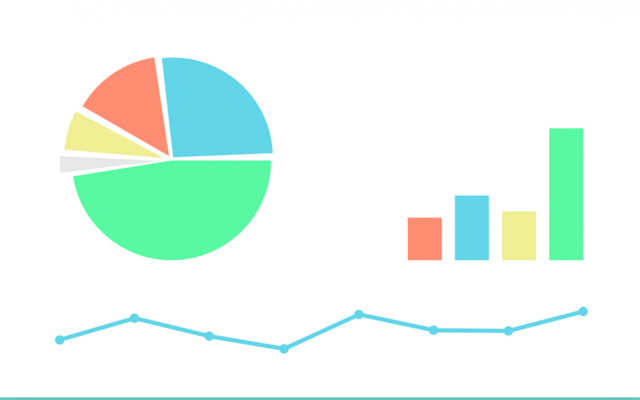
The goal of this unit is for the children to understand the concept of graphing and its uses in the real world. The children will be able to describe, organize and represent data in tables and graphs. This unit will extend to cross curricular lessons in science and writing as well. Aligned to Common Core State Standards: 2.MD.9 , 2.MD.10

Enjoy this graphing unit?

Check out more free lesson plans and resources on Share My Lesson in the 2nd Grade Lesson Plans, Worksheets and Activities Collection.

Resources

Files

beta
EdBrAIn uses AI to customize lesson resources for your students’ needs.

Lesson_#1_Let's_Learn_to_Graph__MK.Cerrito.docx

Lesson Plan
October 20, 2023
19.45 KB
beta
EdBrAIn uses AI to customize lesson resources for your students’ needs.

Lesson_#2_Graphing_MK.Cerrito.docx

Lesson Plan
October 20, 2023
17.08 KB
beta
EdBrAIn uses AI to customize lesson resources for your students’ needs.

Lesson_#3_How_Do_We_Graph_MK.Cerrito.docx

Lesson Plan
October 20, 2023
17.33 KB
beta
EdBrAIn uses AI to customize lesson resources for your students’ needs.

Lesson_#4_How_To_Graph_MK.Cerrito.docx

Lesson Plan
October 20, 2023
18.75 KB
beta
EdBrAIn uses AI to customize lesson resources for your students’ needs.

Lesson_#5_How_To_Graph_MK.Cerrito.docx

Lesson Plan
October 20, 2023
16.77 KB
beta
EdBrAIn uses AI to customize lesson resources for your students’ needs.

Lesson_#6_Graphing_MK.Cerrito.docx

Lesson Plan
October 20, 2023
16.15 KB
beta
EdBrAIn uses AI to customize lesson resources for your students’ needs.

Lesson_#7_and_#8_Talking_About_Graphing_MK.Cerrito.docx

Lesson Plan
October 20, 2023
16.93 KB
beta
EdBrAIn uses AI to customize lesson resources for your students’ needs.

Mary_Kay_Cerrito_Abstract_Revised_outline_gr_2_math.docx

Lesson Plan
October 20, 2023
14.24 KB

Standards

Generate measurement data by measuring lengths of several objects to the nearest whole unit, or by making repeated measurements of the same object. Show the measurements by making a line plot, where the horizontal scale is marked off in whole-number units.
Draw a picture graph and a bar graph (with single-unit scale) to represent a data set with up to four categories. Solve simple put-together, take-apart, and compare problems using information presented in a bar graph.
Robintims
Robintims February 20, 2016

These are very good lessons, thanks!

Advertisement