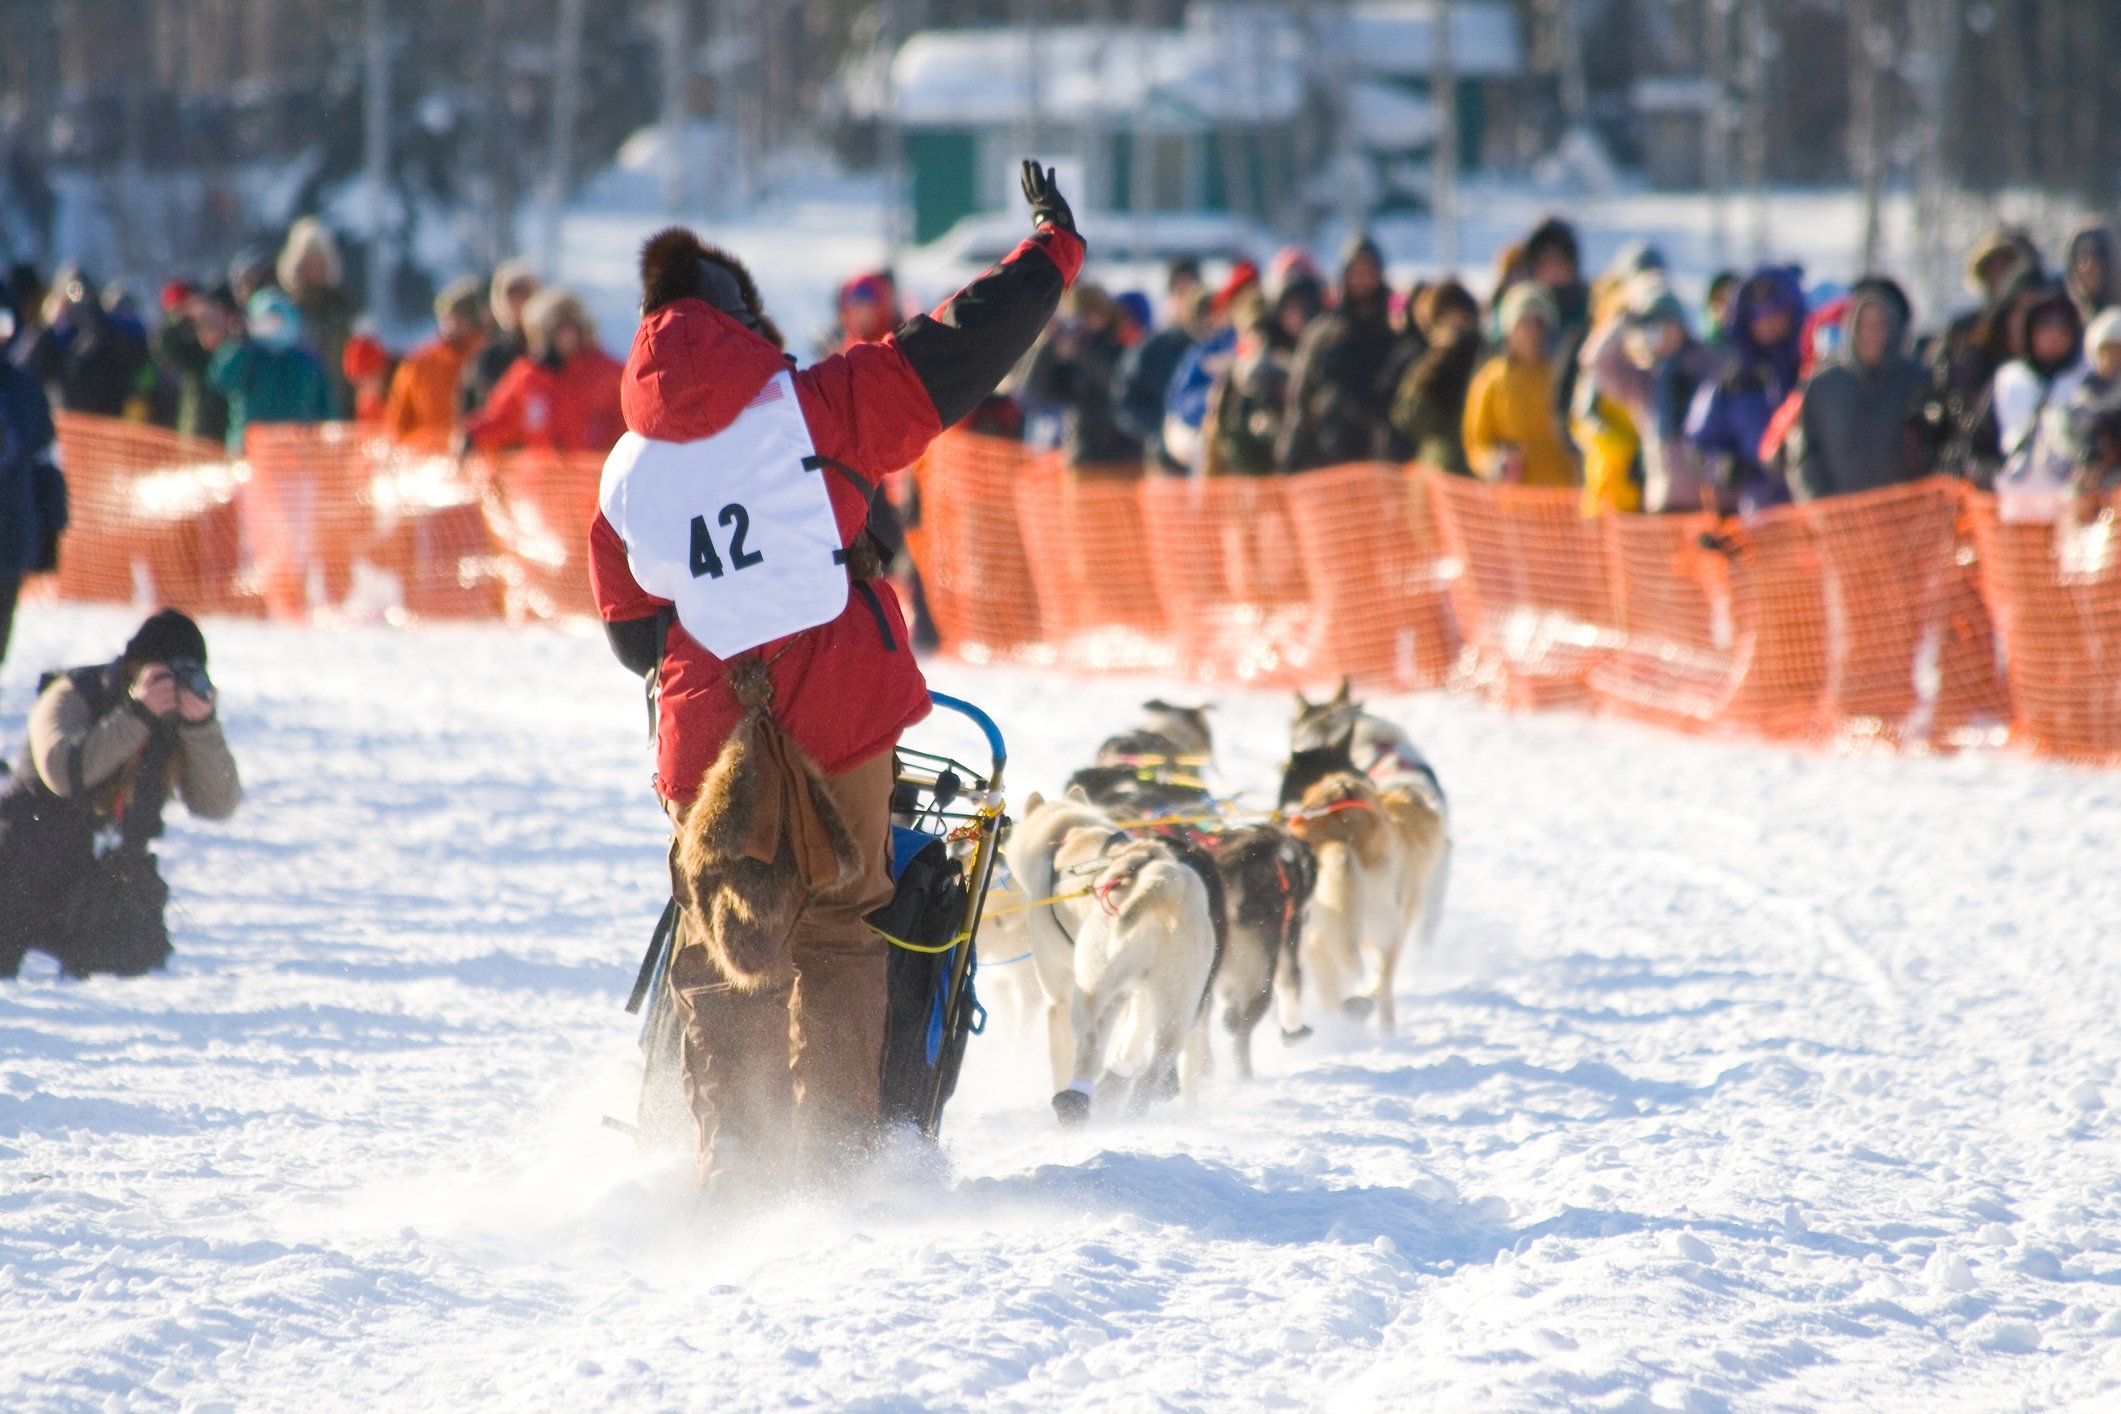
The Greatest Race: Iditarod Dog Sled Race and Trail
lesson
82 Downloads
Write a review
beta
EdBrAIn It
EdBrAIn uses AI to customize lesson resources for your students’ needs.

The Greatest Race: Iditarod Dog Sled Race and Trail

Share

Share On Facebook
Share On Twitter
Share On Pinterest
Share On LinkedIn
Email
Subject Math
Grade Level Grades 6-8
Resource Type Handout, Lesson Plan, Worksheet
Attributes

About This Lesson

Students use the altitudes of the checkpoints on the Iditarod Trail to calculate the differences (positive and negative) in altitude while running the race. Students use some average temperatures (highs and lows) of the checkpoints during March to calculate the differences in temperature, and draw some conclusions about how the geography of the trail affects temperature. These differences in altitude and temperature will be calculated in a Google spreadsheet.

Resources

Files

beta
EdBrAIn uses AI to customize lesson resources for your students’ needs.

Iditarod_Data.xlsx

Handout, Worksheet
February 13, 2020
42 KB
beta
EdBrAIn uses AI to customize lesson resources for your students’ needs.

Iditarod_Lesson.docx

Lesson Plan
February 13, 2020
17.76 KB
beta
EdBrAIn uses AI to customize lesson resources for your students’ needs.

Iditarod_Race_Rubric.docx

Worksheet
February 13, 2020
20.05 KB

Reviews

Write A Review

Be the first to submit a review!

Advertisement