Hudson River Line Food
lesson
9 Downloads
Write a review
beta
EdBrAIn It
EdBrAIn uses AI to customize lesson resources for your students’ needs.

Hudson River Line Food

Share

Share On Facebook
Share On Twitter
Share On Pinterest
Share On LinkedIn
Email
Subject MathSocial Studies
Grade Level Grades 9-12
Resource Type Lesson Plan
Attributes
Standards Alignment
State-specific

About This Lesson

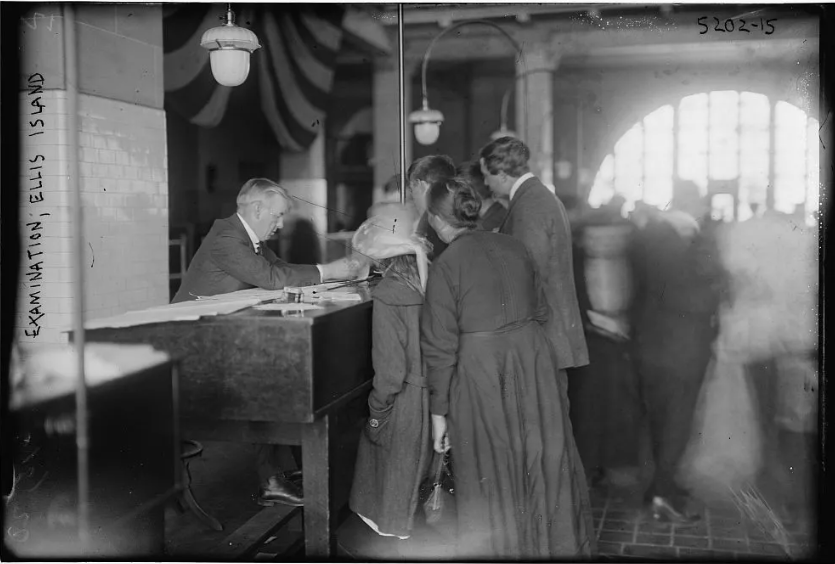
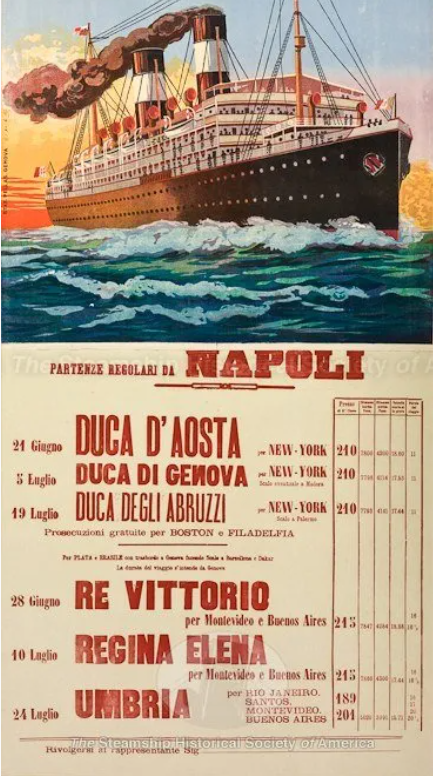
MATH/SOCIAL STUDIES – This lesson allows students to view primary source materials and draw historical conclusions based on food purchases. Students can also utilize these sources for mathematical calculations.

Learning Objectives:

  • Create a line graph based on historical information. 
  • For younger students you can change the amounts to numbers that are easier to work with.

Common Core Standards:

3.MD.B.3: Draw a scaled picture graph and a scaled bar graph to represent a data set with several categories. Solve one- and two-step “how many more” and “how many less” problems using information presented in scaled bar graphs. For example, draw a bar graph in which each square in the bar graph might represent 5 pets.

Resources

Files

beta
EdBrAIn uses AI to customize lesson resources for your students’ needs.

Lesson Title_ Hudson River Line_ Food.docx

Lesson Plan
April 2, 2025
8.4 KB
Videos
Hudson River Day Line (No Sound)
Remote video URL
Steamboats On the Hudson
Remote video URL

Standards

Draw a scaled picture graph and a scaled bar graph to represent a data set with several categories. Solve one- and two-step “how many more” and “how many less” problems using information presented in scaled bar graphs.

Reviews

Write A Review

Be the first to submit a review!

Advertisement