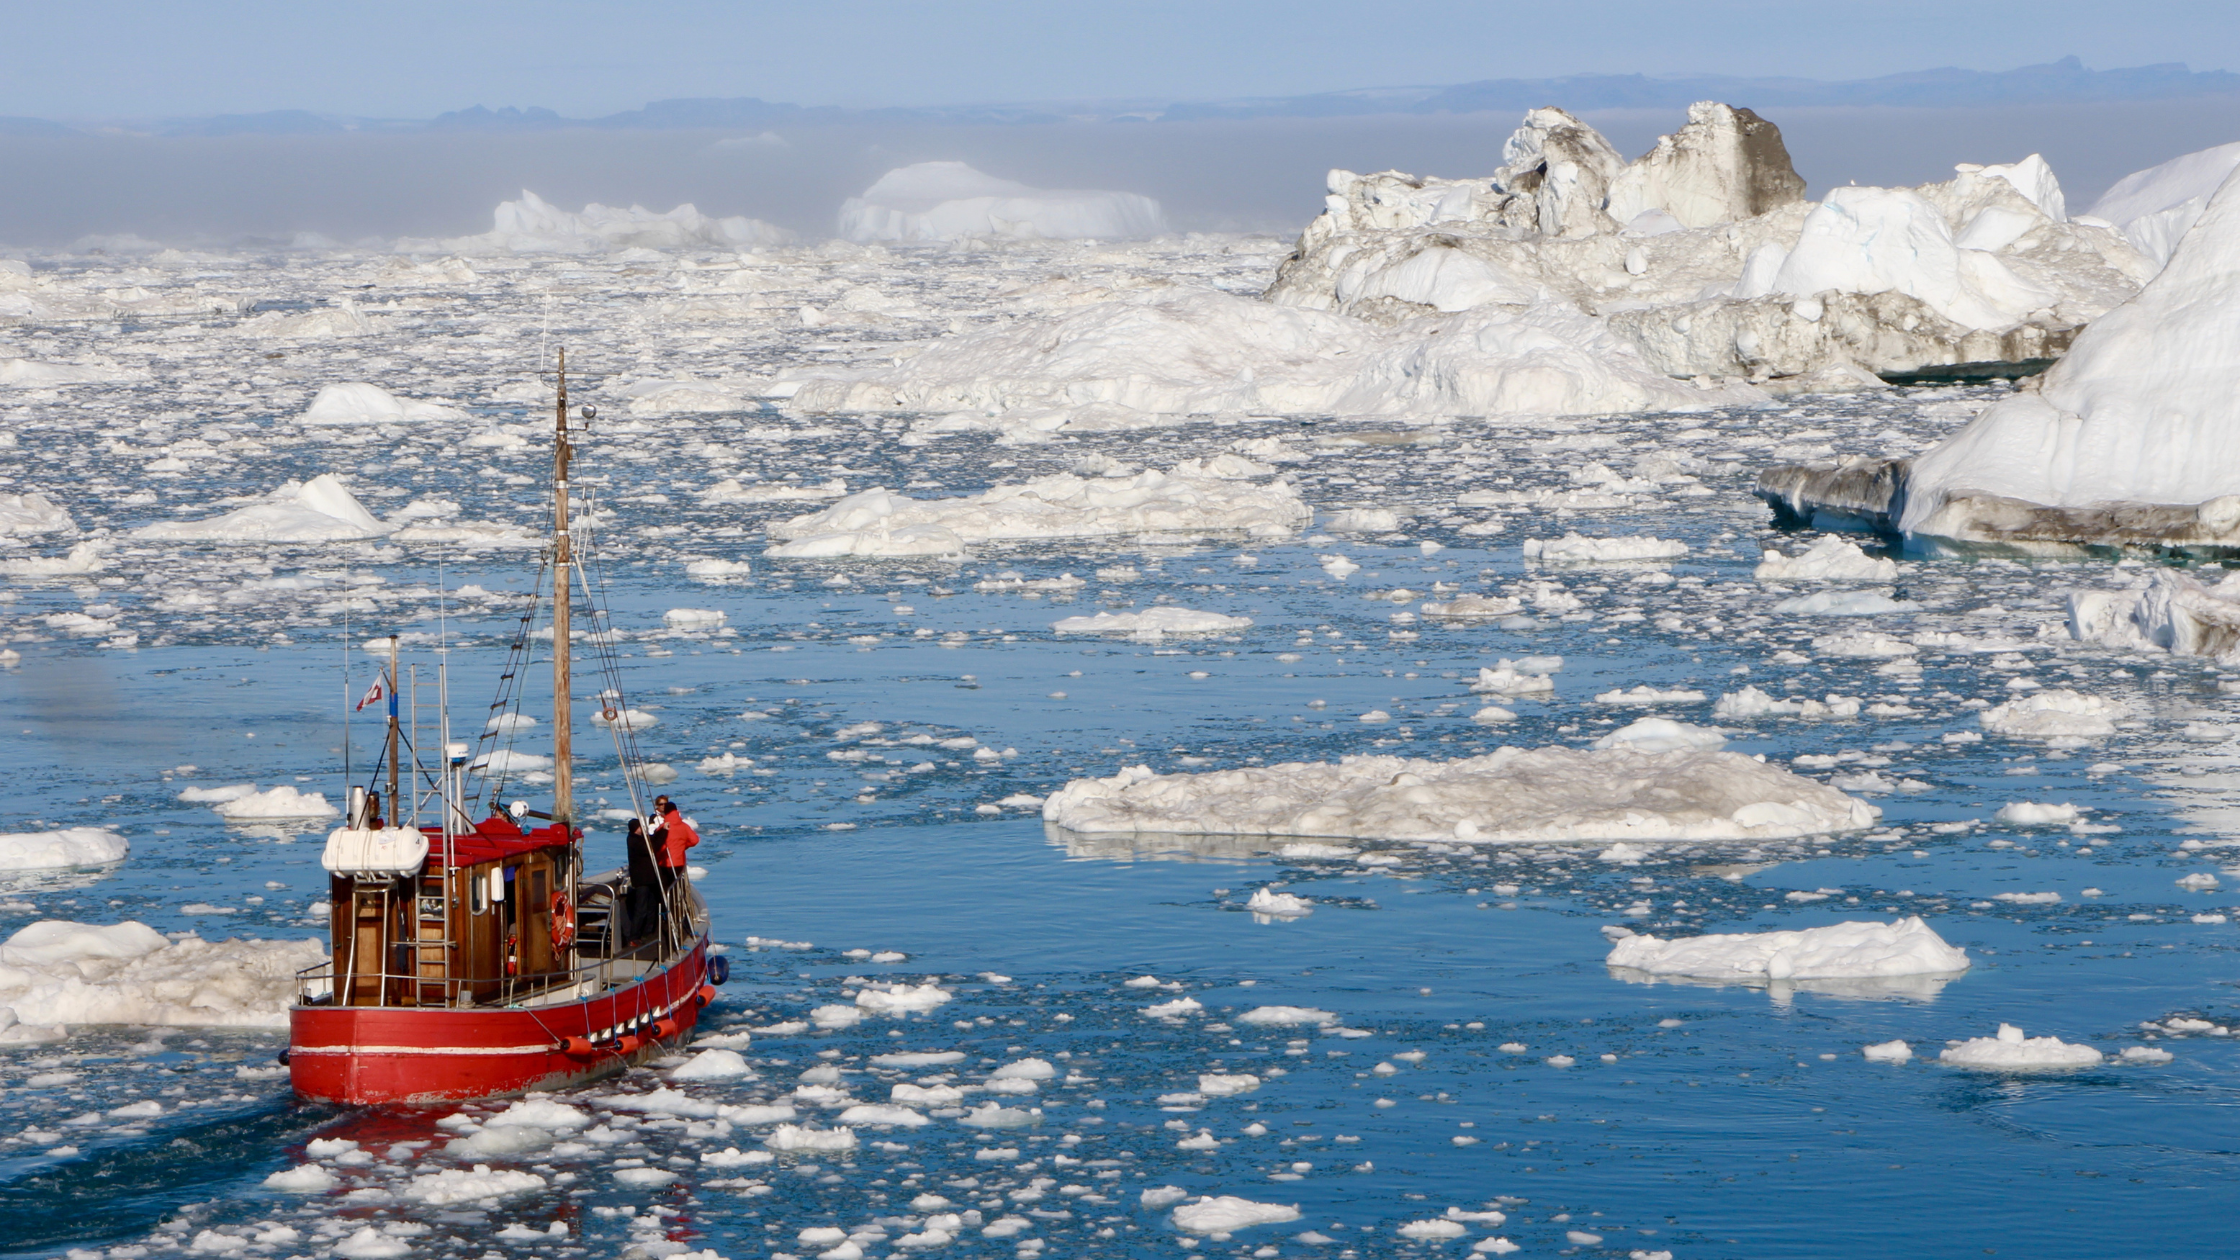
Infographics & Climate Change Impact on the Arctic
lesson
4 Downloads
Write a review
beta
EdBrAIn It
EdBrAIn uses AI to customize lesson resources for your students’ needs.

Infographics & Climate Change Impact on the Arctic

Share

Share On Facebook
Share On Twitter
Share On Pinterest
Share On LinkedIn
Email
Grade Level Grades 6-8
Resource Type Lesson Plan
Standards Alignment
State-specific

About This Lesson

Access Free Lesson Plan Here: The Arctic in Infographics

This lesson introduces students to the impacts of climate change on the Arctic. 

Step 1 - Inquire: Students learn about the circumpolar Arctic and its geography and explore infographics as a way of conveying information about climate change impacts in the Arctic.

Step 2 - Investigate: Students watch a short video from the youth perspective about the impacts of climate change in one Canadian Arctic community and learn more about how climate change is impacting the Arctic.

Step 3 - Inspire: Students research one of their questions and design an infographic.

Learning Outcomes

  • Students will be able to locate the Arctic and name the circumpolar Arctic countries.
  • Students will be able to ask questions to deepen their understanding of complex topics.
  • Students will be able to explain different impacts of climate change on the Arctic.
  • Students will be able to display information and ideas visually.

More Free Stuff!

Free Lesson Plans

Free News Articles for Students

2000+ Free Resources for Teachers

Register Now

Resources

Files

beta
EdBrAIn uses AI to customize lesson resources for your students’ needs.

The Arctic in Infographics - SubjectToClimate - SML.pdf

Lesson Plan
April 24, 2023
940.36 KB

Standards

Use maps, satellite images, photographs, and other representations to explain relationships between the locations of places and regions, and changes in their environmental characteristics.
Integrate quantitative or technical information expressed in words in a text with a version of that information expressed visually (e.g., in a flowchart, diagram, model, graph, or table).
Ask questions to clarify evidence of the factors that have caused the rise in global temperatures over the past century.

Reviews

Write A Review

Be the first to submit a review!

Advertisement