


About This Lesson
SWABT graphically show evolutionary relationships between species by using molecular genetics.
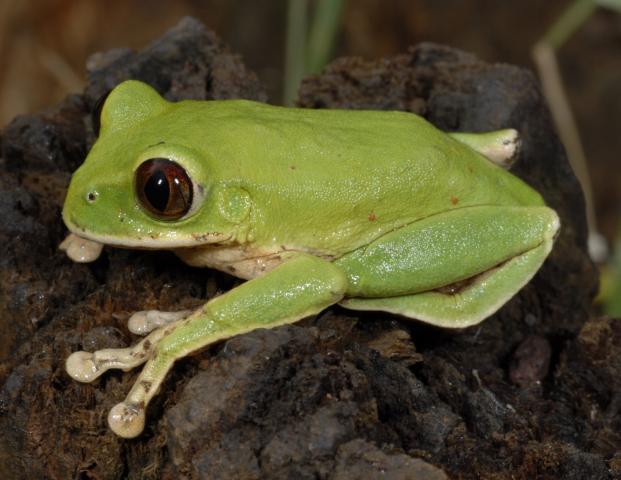
Student read a blog post about a researcher who has spent his life working to catalog the frogs and amphibians of Central Africa's jungles. Students then build a cladogram of 5 species of frogs using their respective DNA sequences.


I love phylogenetics, but after counting 10 differences between the two example species when "9" is what is listed, I was confused about what the use of the table was for (if not for tallying the difference between species). I have read in the instructions that students are to, indeed, count the number of differences. But now I feel that maybe a key of the solved cladogram would be beneficial.